Your Insightsexpenses
You spent
21,796.43 EGP
over 18 transactionsYour expenses (18)
View all
Your categories (6)View all
Your categories (6)
View all
Your Insightsexpenses
You spent
21,796.43 EGP
over 18 transactionsYour expenses (18)
View all
Your categories (6)View all
Your categories (6)
View all
Previous Insights screen
Redesigned Insights screen

Nadia, Tariq and I ran the interviews
Flash · Insights · 2026
Making spending
easier to understand.
Flash's expense tracking was barely used. Most of the people I interviewed did not know it existed, and the few who had opened it found a chart instead of their expenses. I redesigned the screen so the expenses come first.
- Role
- Product designer. I ran one interview segment, then owned the UI and UX through to the final screens
- Company
- Flash, consumer fintech
- Year
- 2026
- Tools
- Figma
- 10interviews I ran with heavy Flash users who had never opened Insights
- 3directions taken from wireframe to UI before choosing one
- Handed offdesigned and handed to engineering, waiting on release
01 · The starting point
A feature that few people used
Flash already tracked expenses on a screen called Insights. Anything paid through Flash was added automatically, and people could add other expenses by hand. The feature was barely getting used, so the team ran research to find out why.
My role
One segment, then the design
Nadia, the product design lead, wrote the research plan. She, Tariq and I ran the interviews. I ran one segment, then took the project from the problem it surfaced to the final screens.
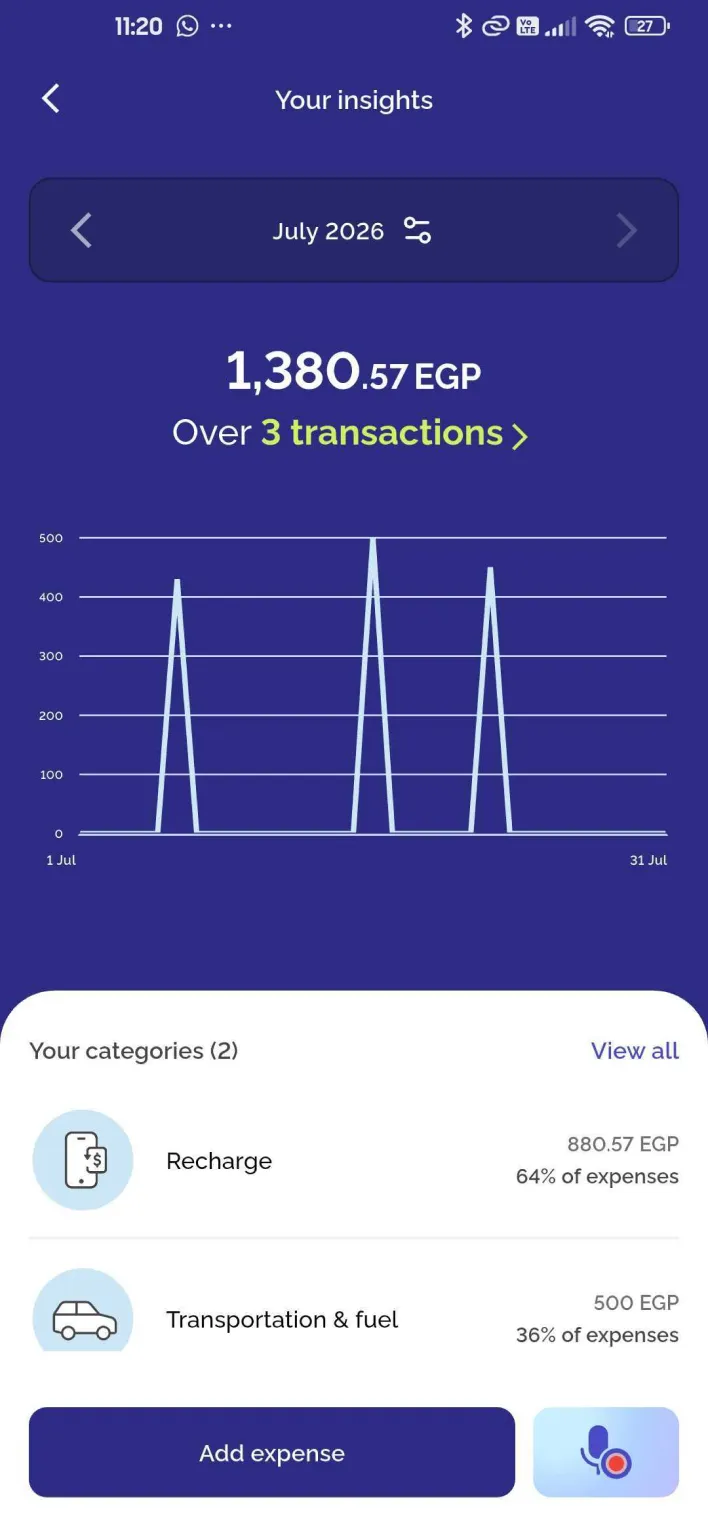
The live screen
A chart and top categories
The expenses themselves were one tap away, behind a small transactions link under the total.
02 · Research
What the research found
Nadia planned four behavioural segments. I took the fourth: heavy Flash users who had never opened Insights once. The team also reviewed how people moved through the screen.
- Mostvisitors left straight back to Home within seconds of arriving
- Almost noneof the people who visited ever added an expense
- Every oneof the heavy users I interviewed had never heard of the feature
Research plan: Nadia Safwat, product design lead. Interviews: Nadia Safwat, Tariq Ragab and me, covering three of the four planned segments.
03 · The problem
Invisible on two levels
The research turned one question into two problems, so the design had two jobs: make the feature discoverable from the home screen, and fix the information hierarchy inside so expenses stop hiding behind a link.
Level 1 · The home screen
People did not know it existed
Most of the people I interviewed did not know Flash had expense tracking at all. The home screen entry was called Insights, which does not say that it tracks expenses.
Level 2 · Inside the screen
Expenses hid behind a link
The few who had opened it found a chart and their top categories. Their expenses were one tap away, behind a transactions link under the total that nobody noticed.
04 · Wireframes
Structure first, in grey boxes
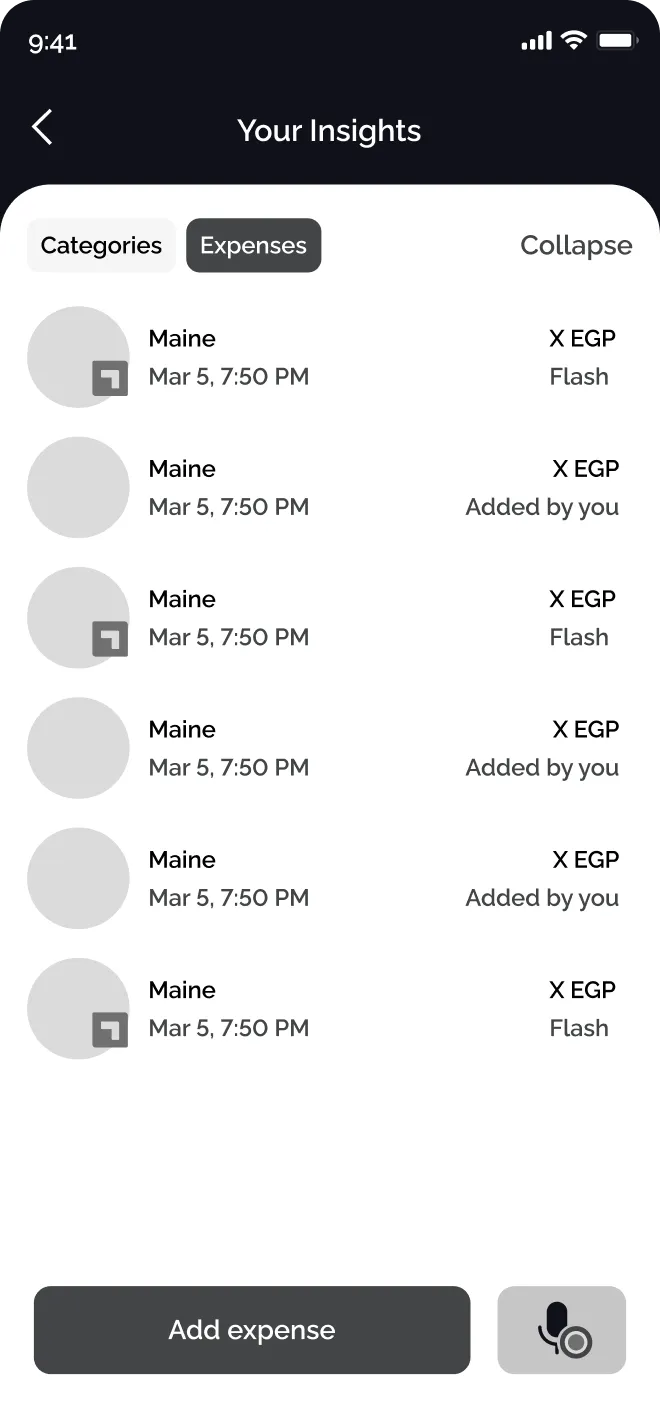
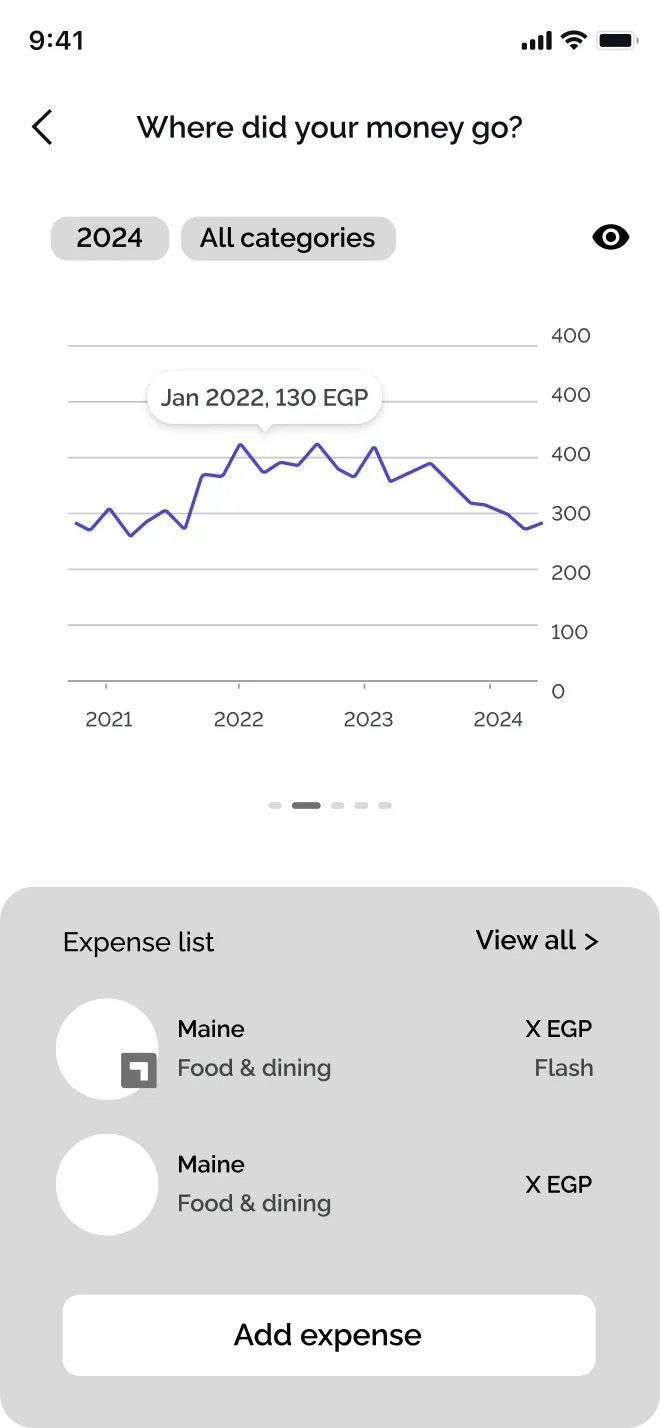
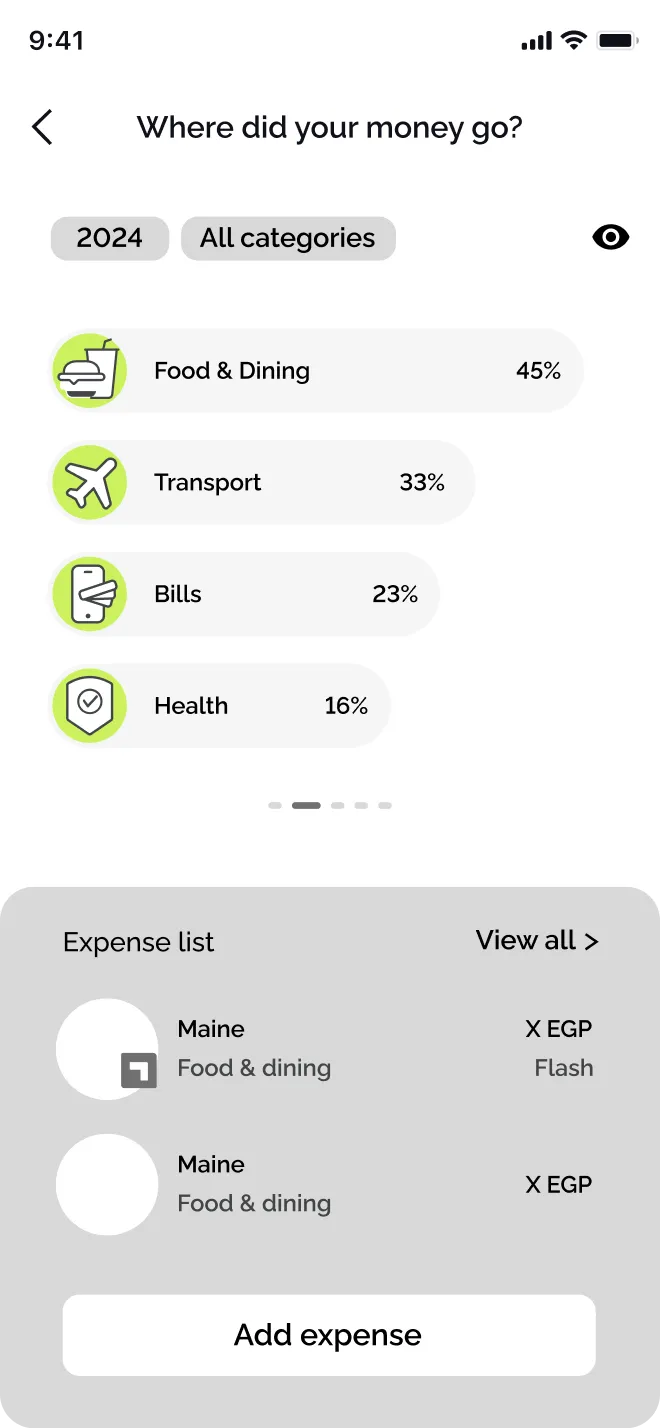
I started with information architecture, before any colour: where the expenses sit, whether categories share the screen, and what the entry point to a full list should be. I wireframed three structures.
The way in from the home screen
The other half of the problem was reaching someone on the home screen who does not know expense tracking exists. I tried a Track tab, a spending card in the feed, and a place in the bottom navigation.
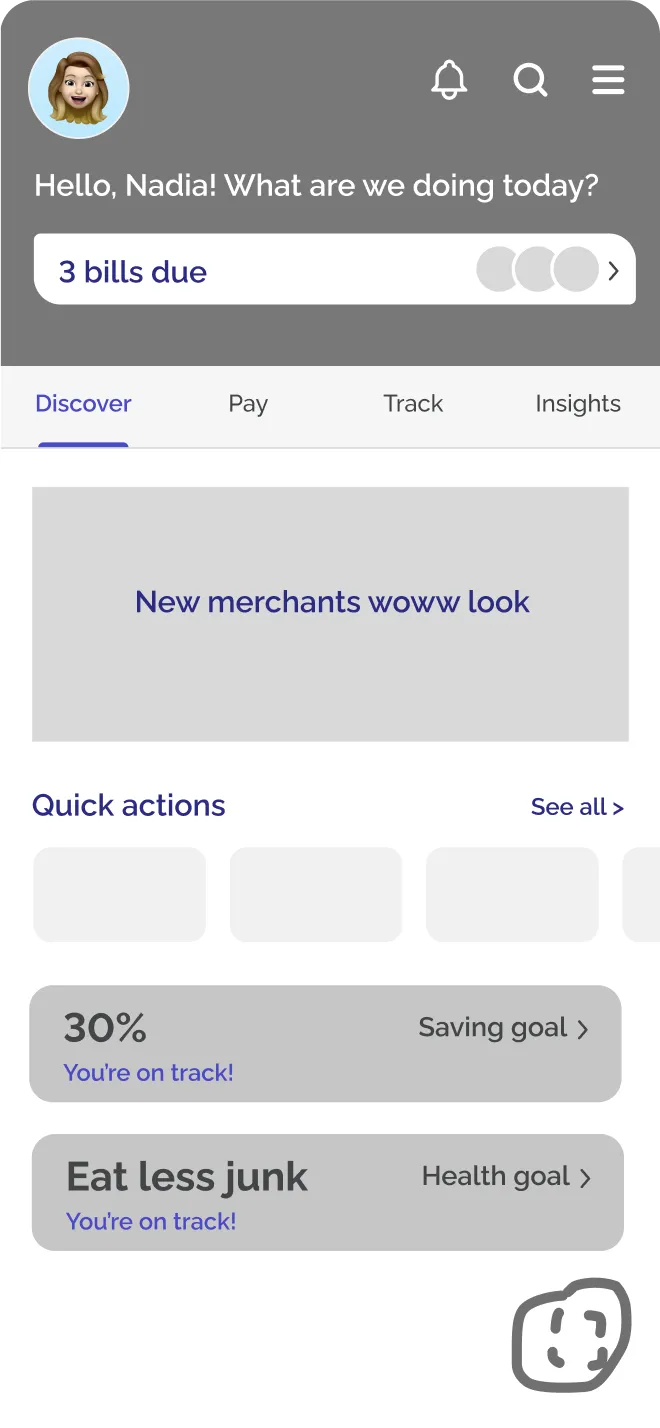
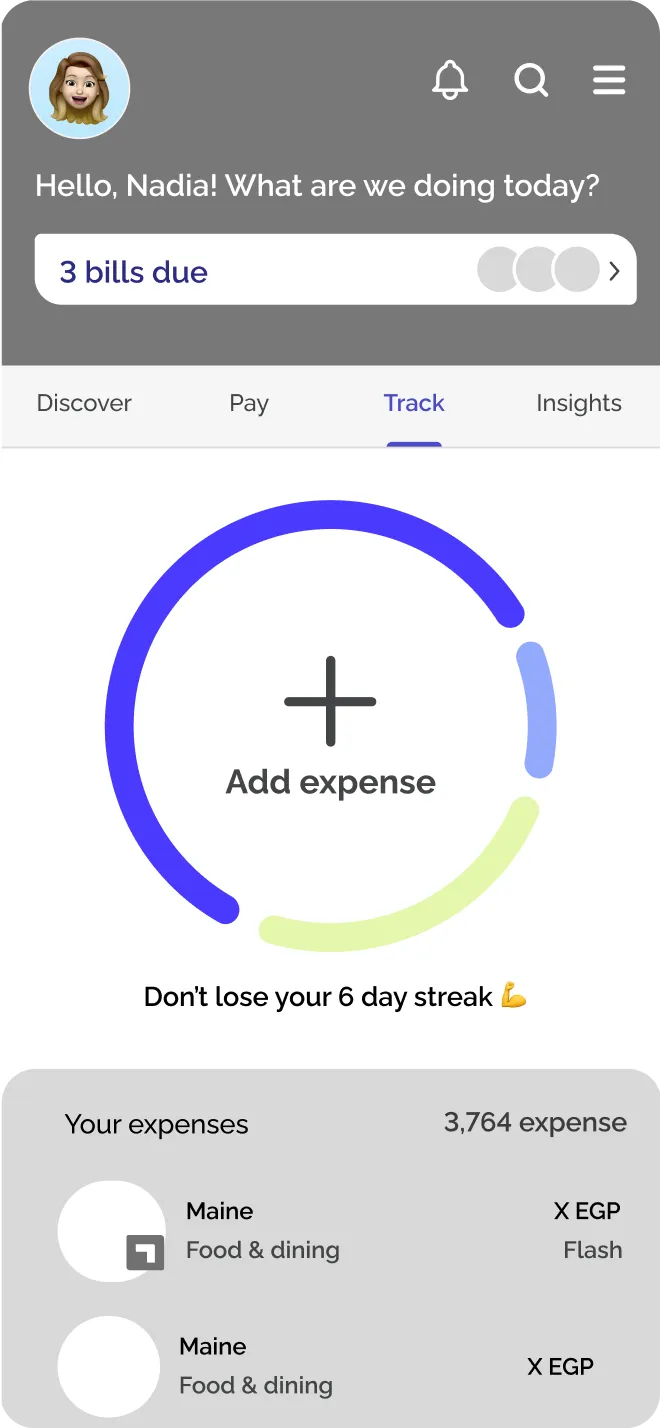
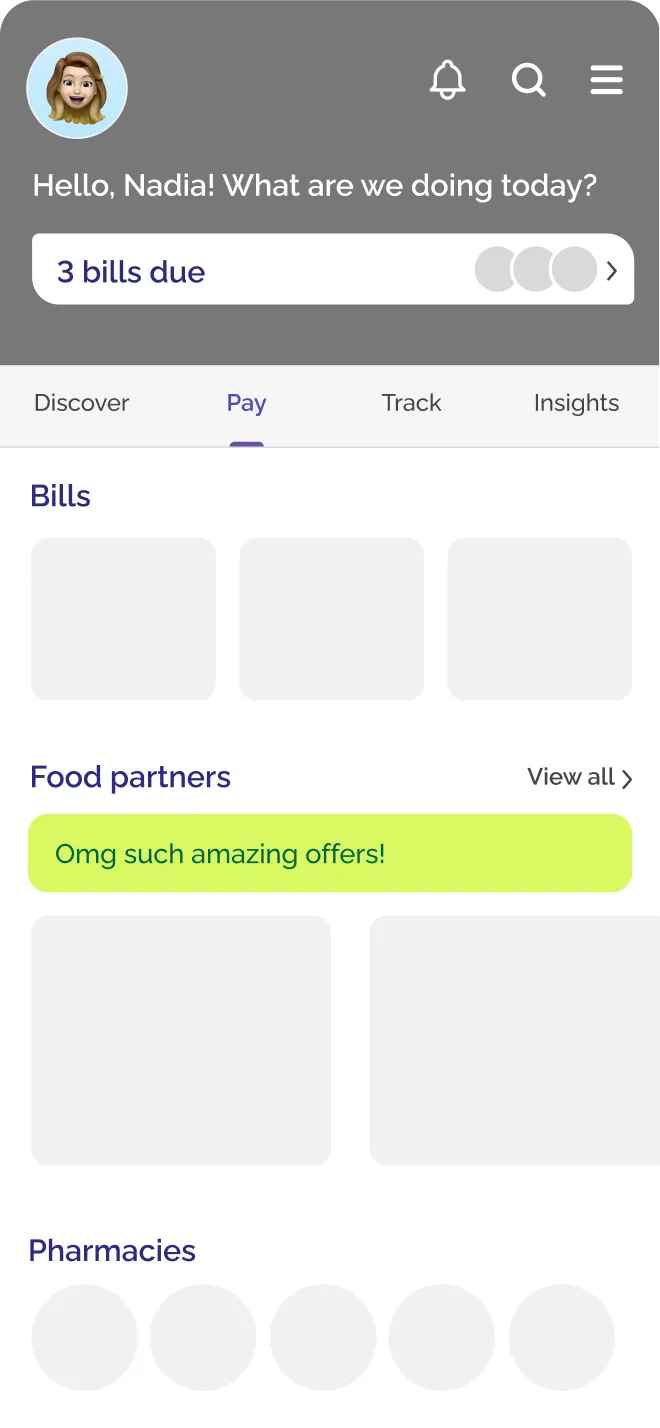
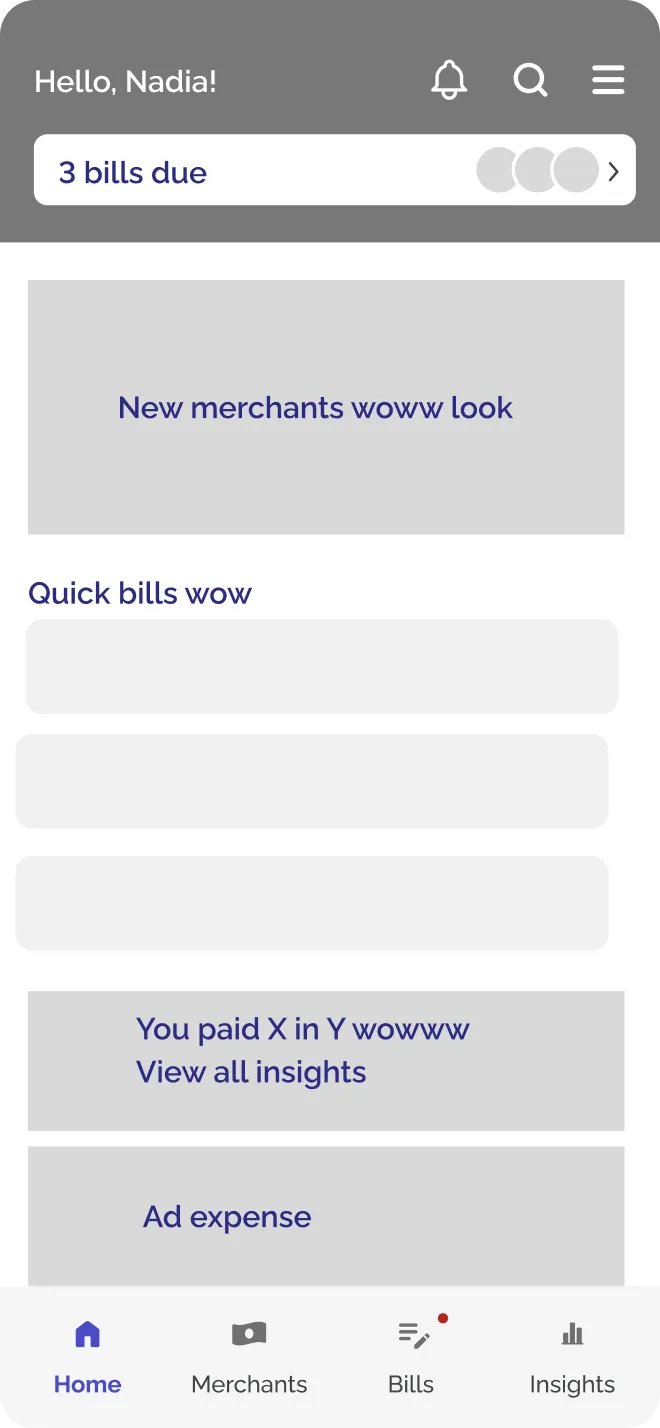
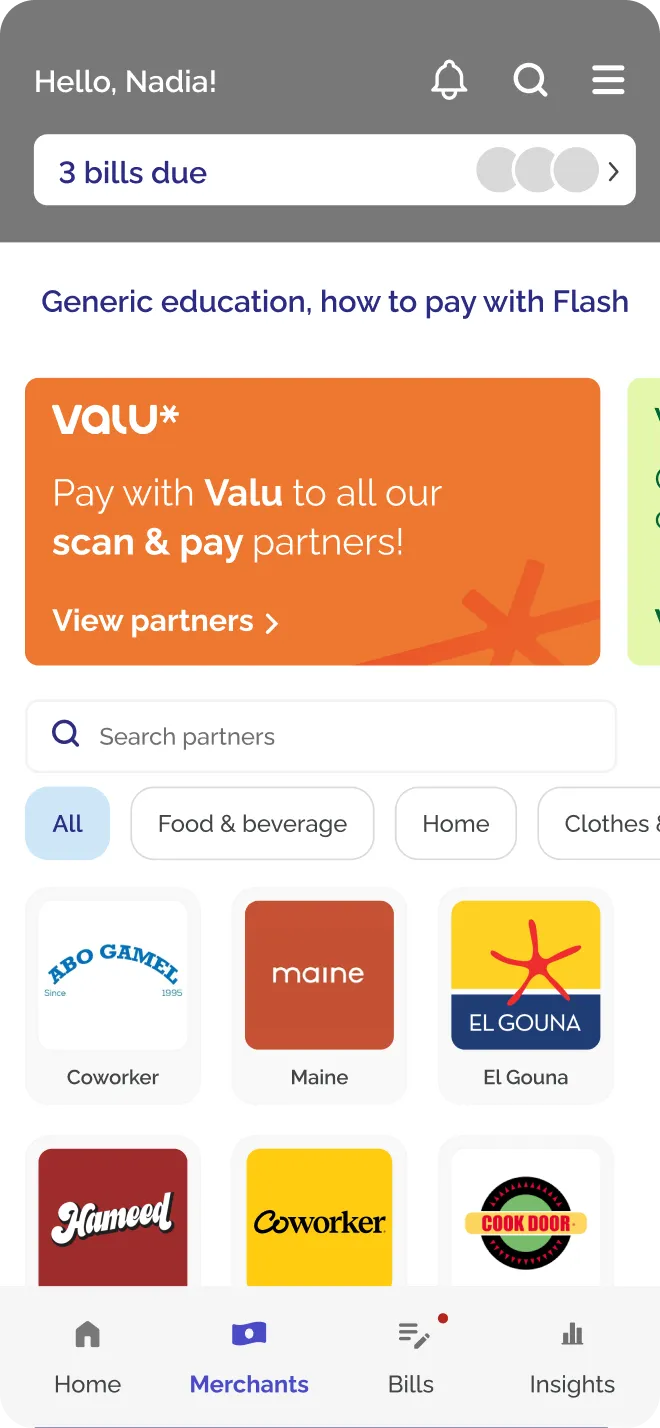
Entry points tried on the home screen, before the screen itself was settled.
05 · Directions
The directions weighed
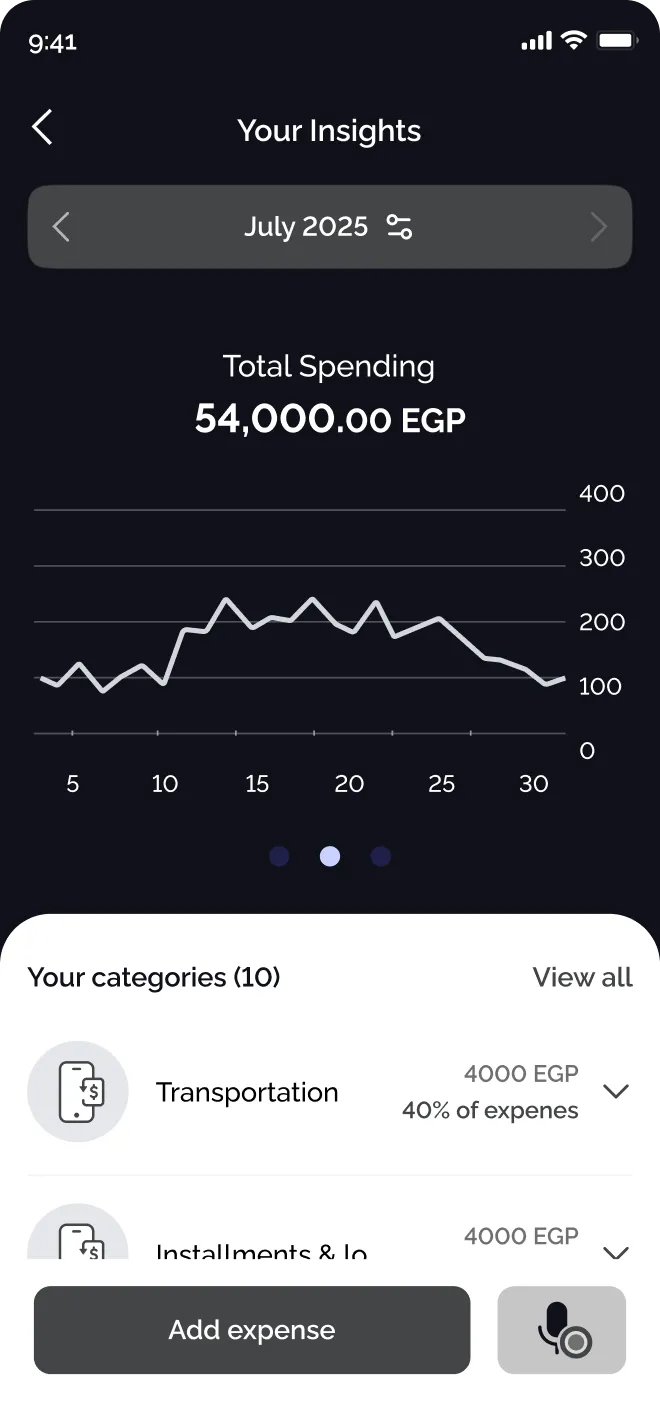
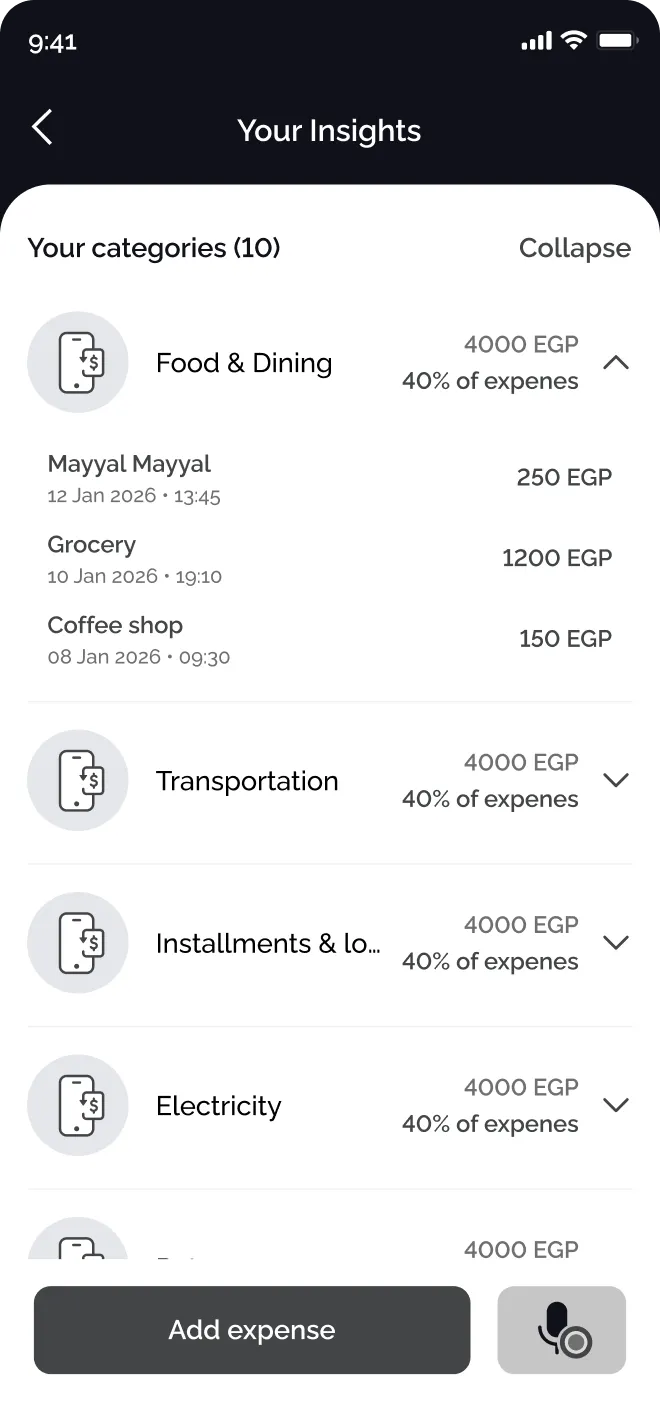
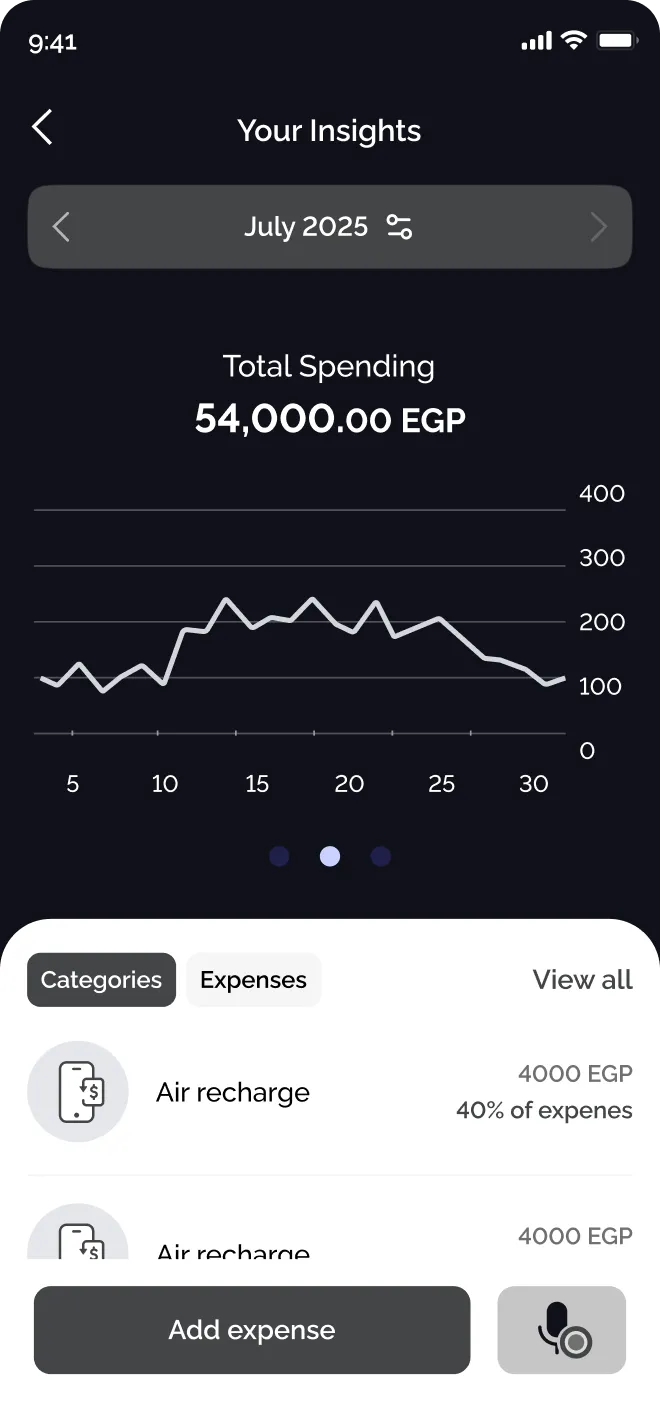
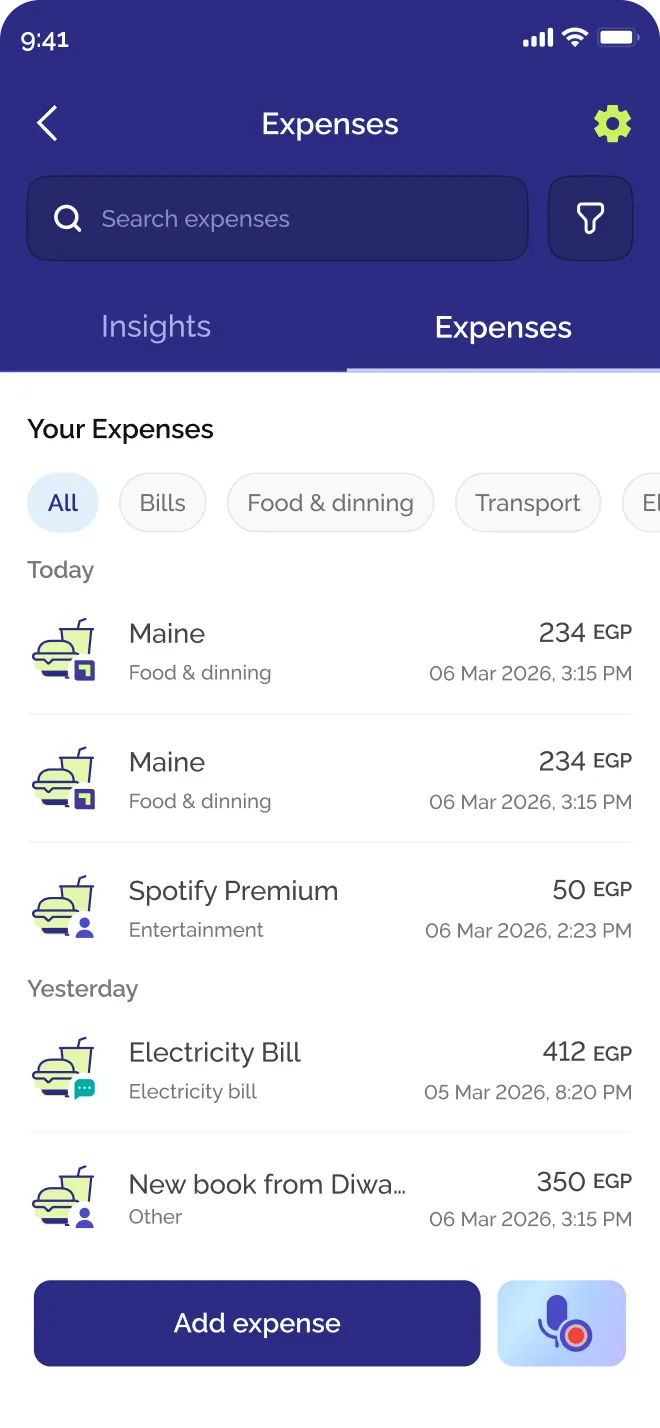
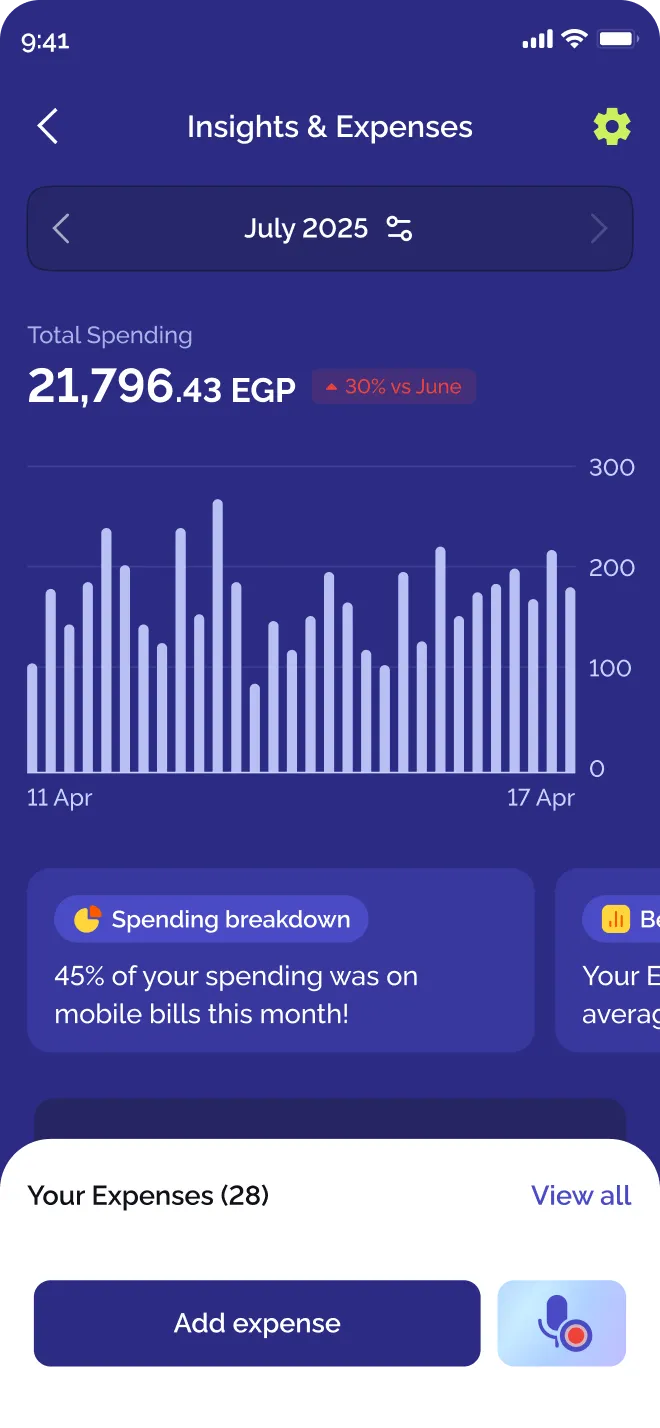
Three directions went from wireframe to UI: separate tabs, expenses rising over the insights, and everything on one screen.
Separate tabs
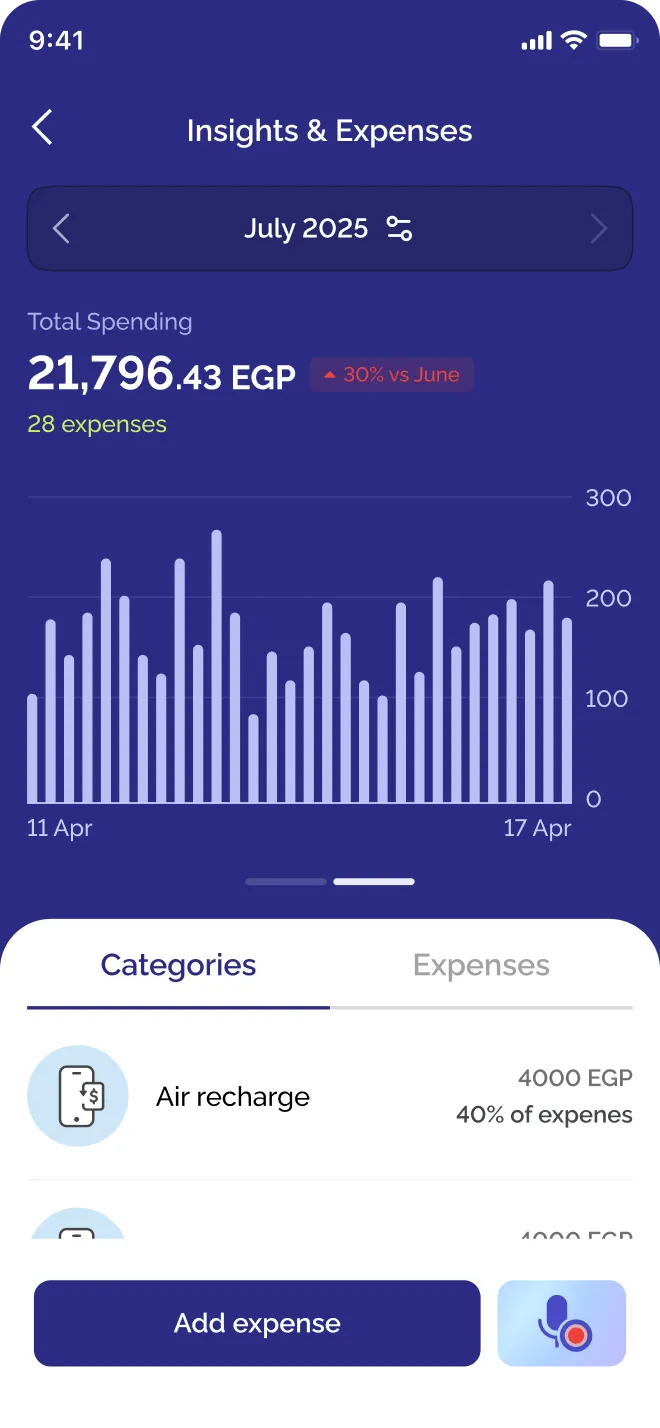
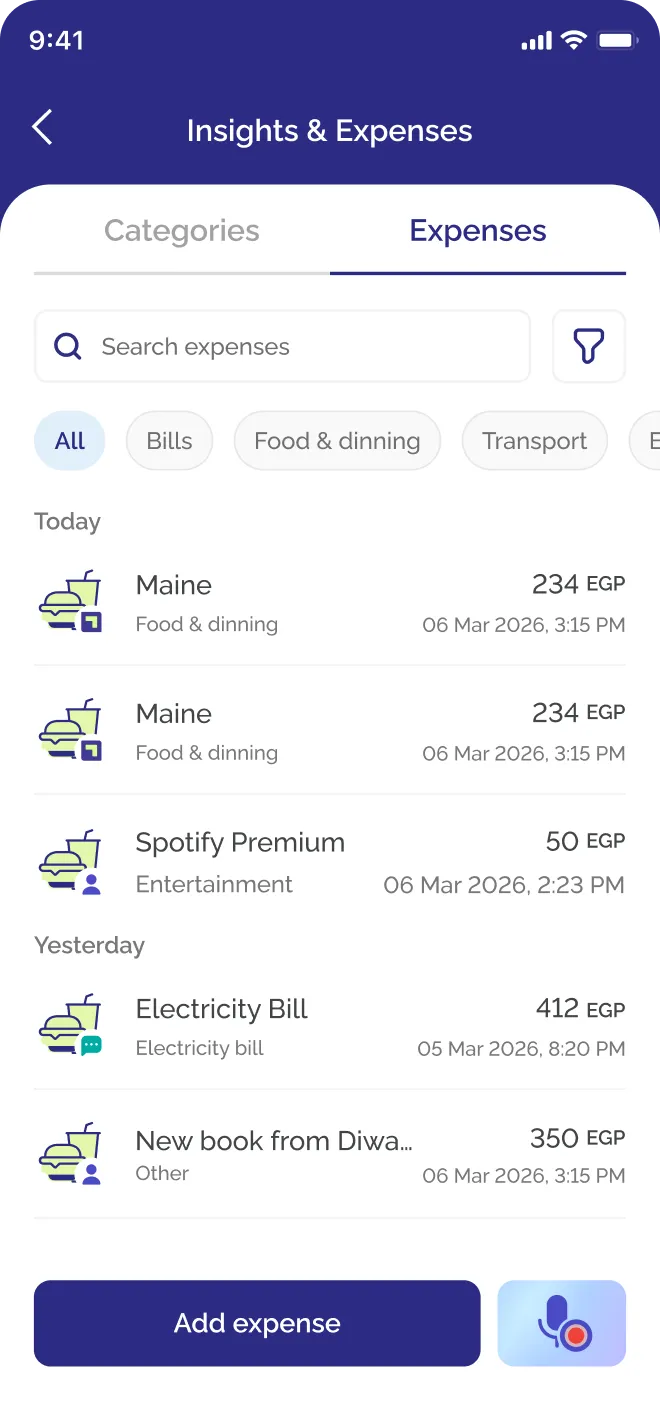
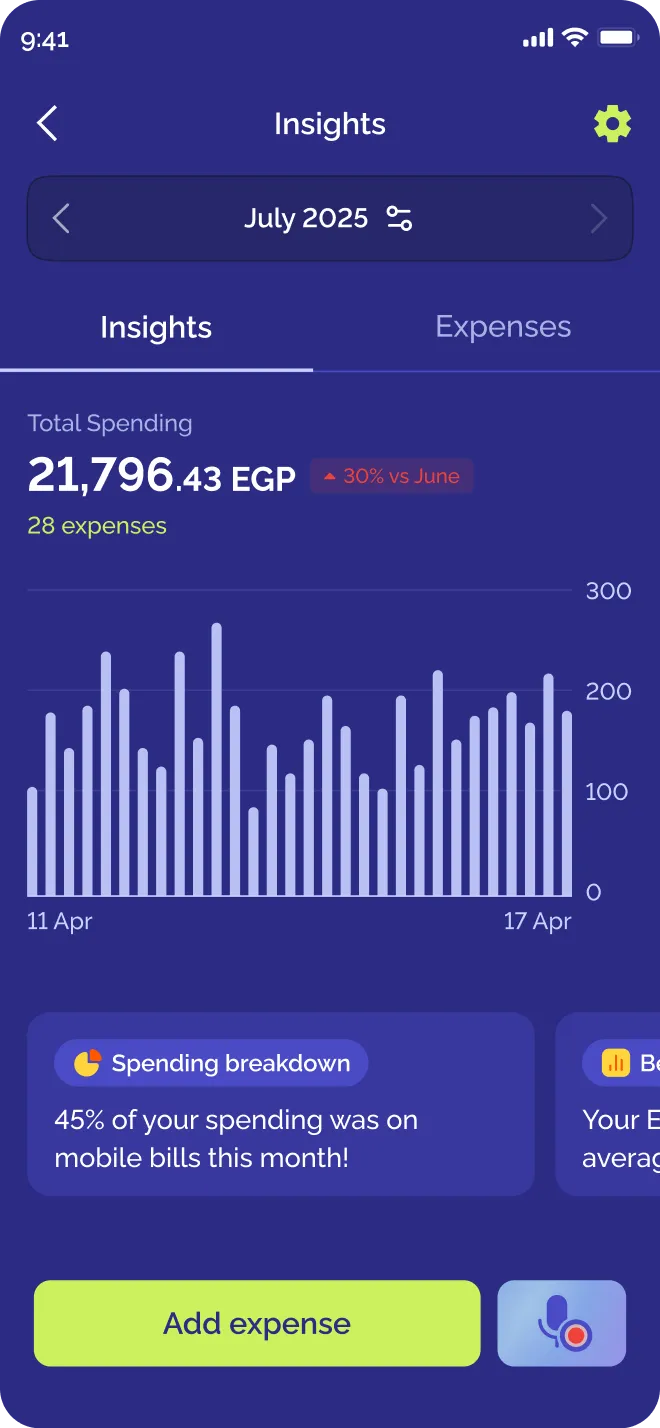
Clearer, but the hierarchy fights itself. Filters sit above the tabs they control, and the tab name repeats the home entry.
Expenses over insights
Too dynamic. Expenses rising over the insights complicated the interaction, with no clear benefit in return.
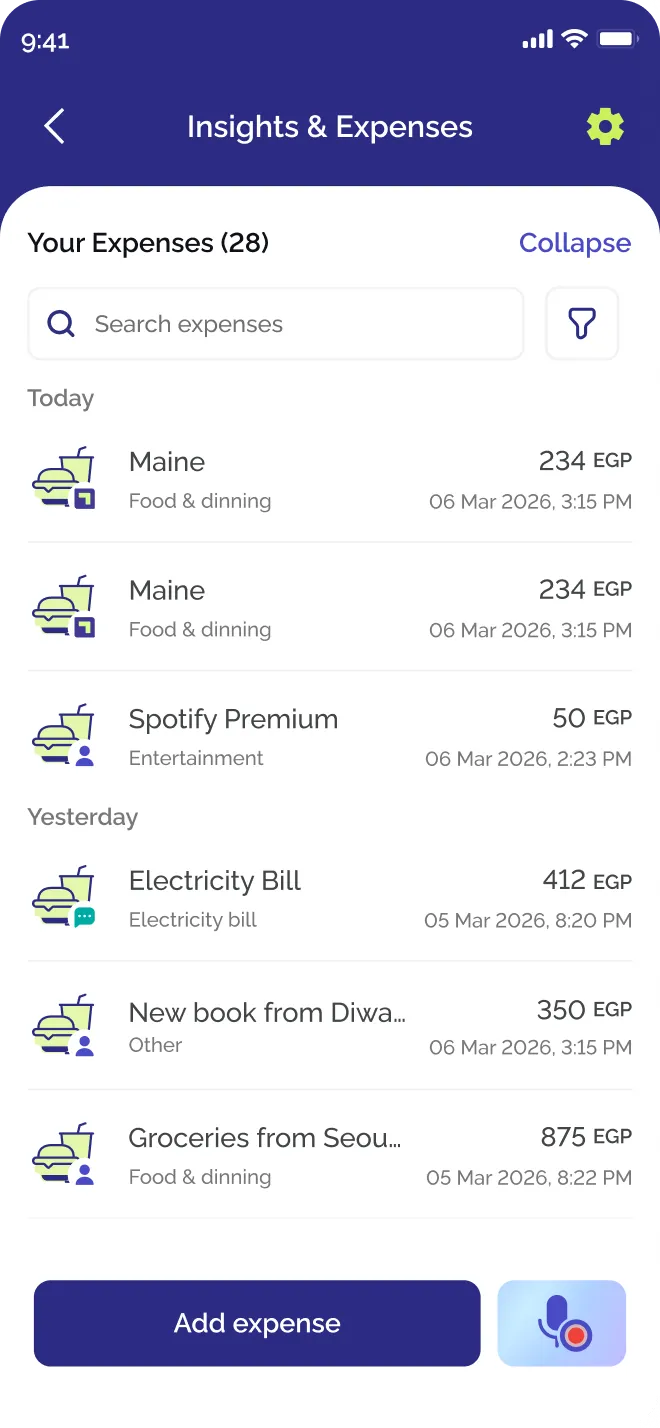
Too dynamic. Expenses rising over the insights complicated the interaction, with no clear benefit in return.
All in one screen
Everything in one scrollOne set of filters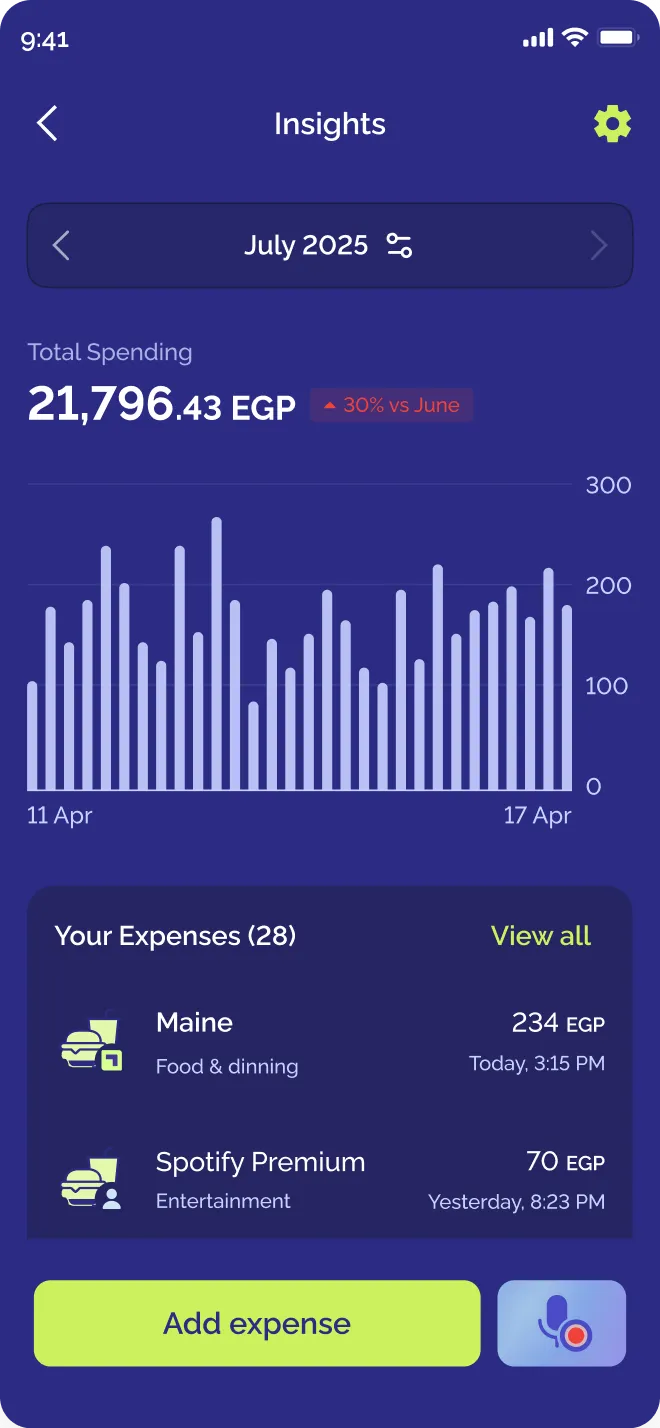
06 · The final screen
The final screen
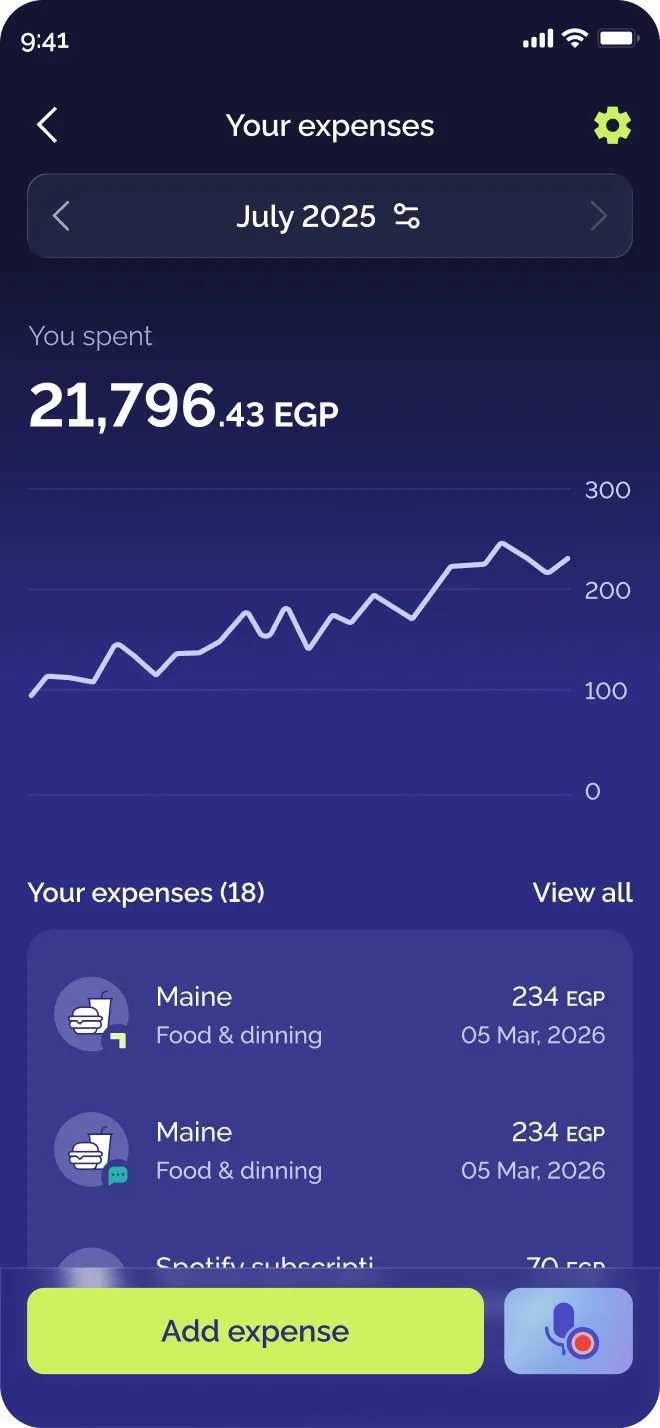
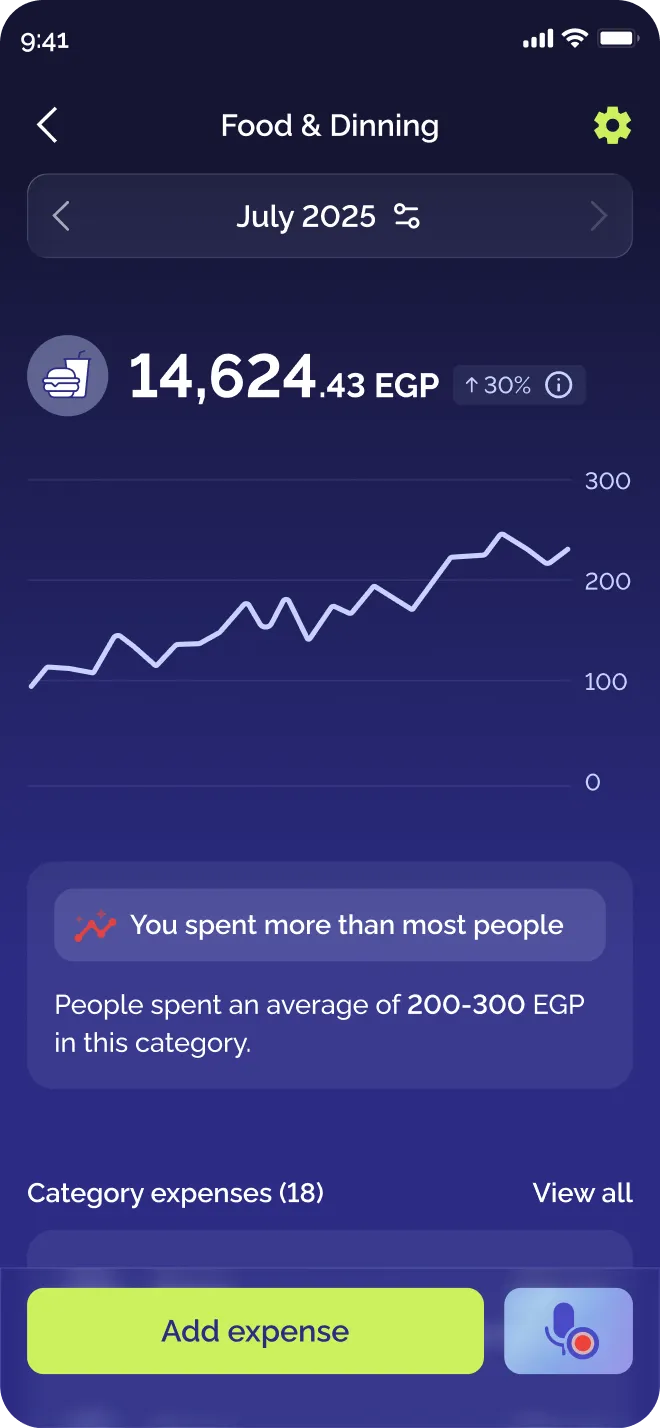
Expenses now sit on the screen people land on, under the total and the trend. The same structure carries into each category.
01
Now they sit in the expenses page
Spending, the list of expenses and the categories all read without a tap, which is what people asked for in their own words.
02
Flash payments were already there
Anything paid through Flash was always added automatically. The screen now shows those expenses, so it is full even for people who never log by hand.
03
From Insights to Expenses
The home screen entry and the screen title now both say Expenses, so people who never knew this existed can tell what it is before tapping.
07 · Across the flow
Across the whole flow
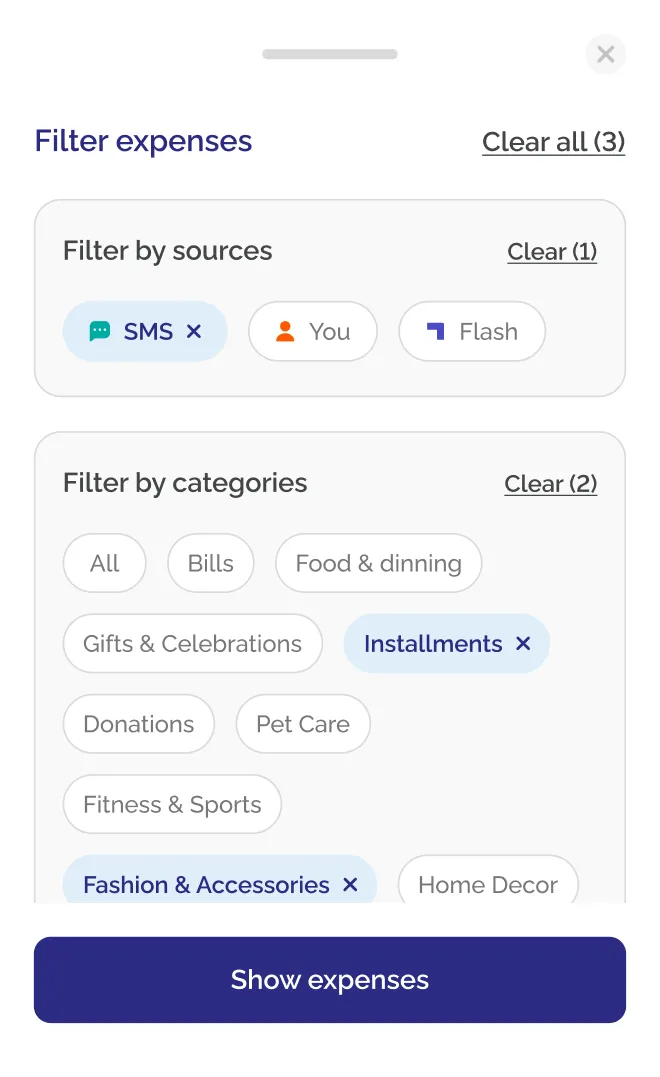
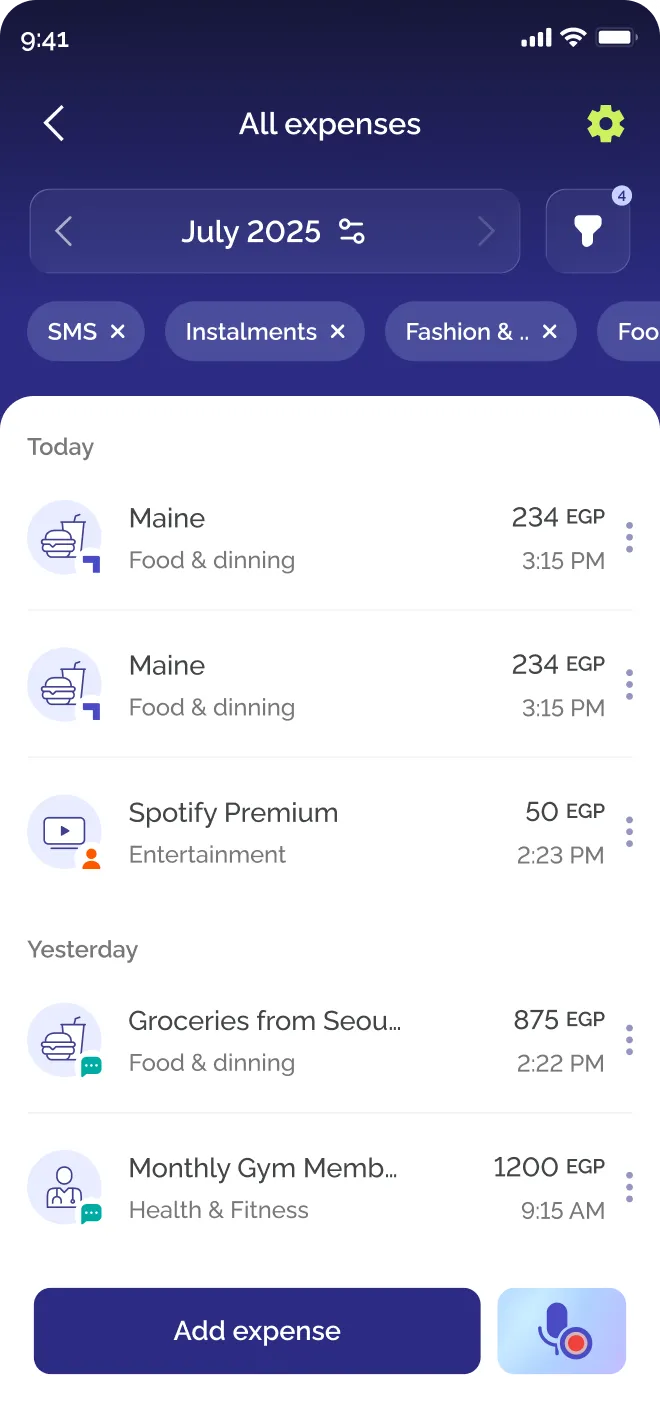
Making expenses the point meant building the rest around them: a full list you can search, filters by category and by source, and a clear label for what Flash added and what you added yourself.
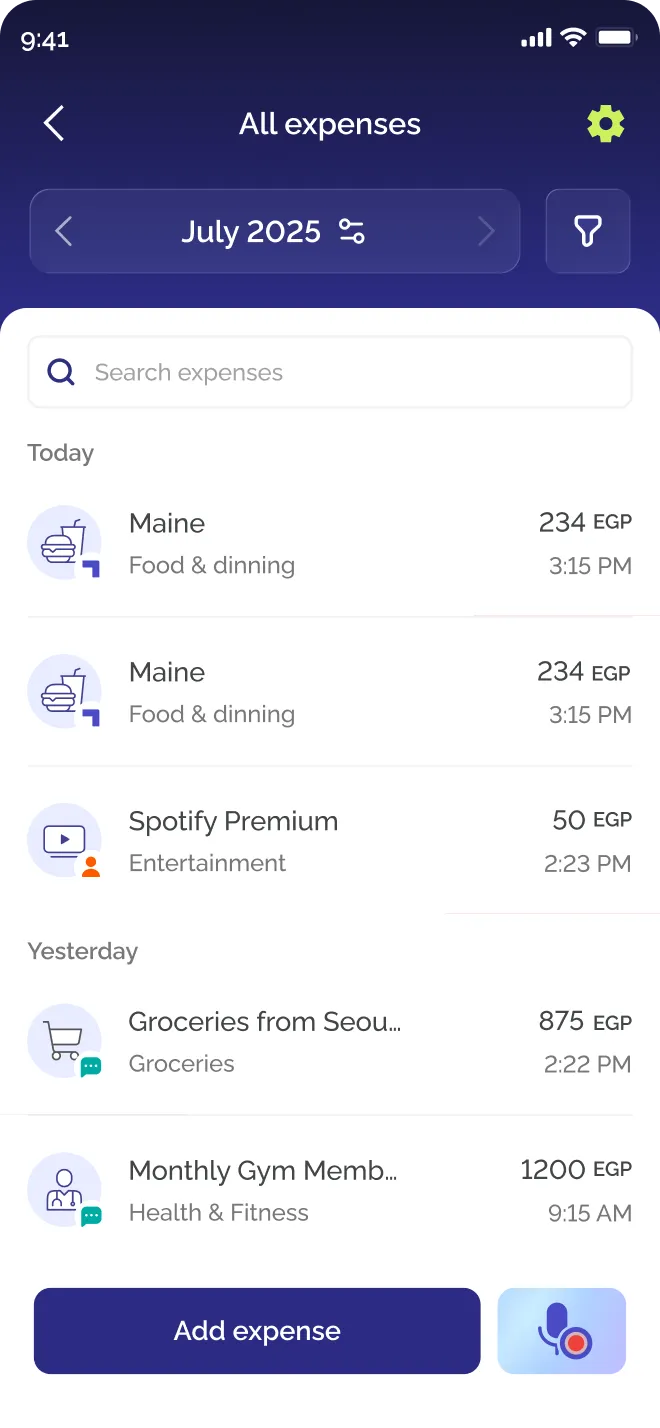
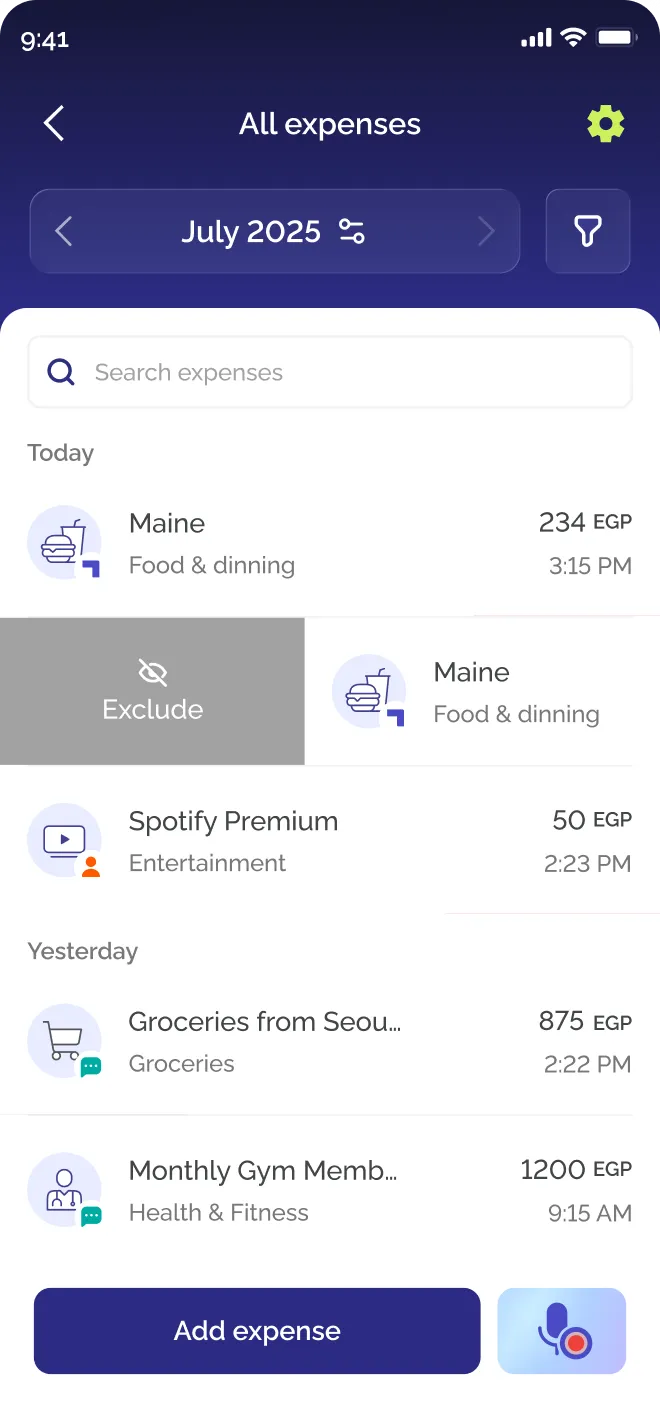
Managing an expense, and learning how
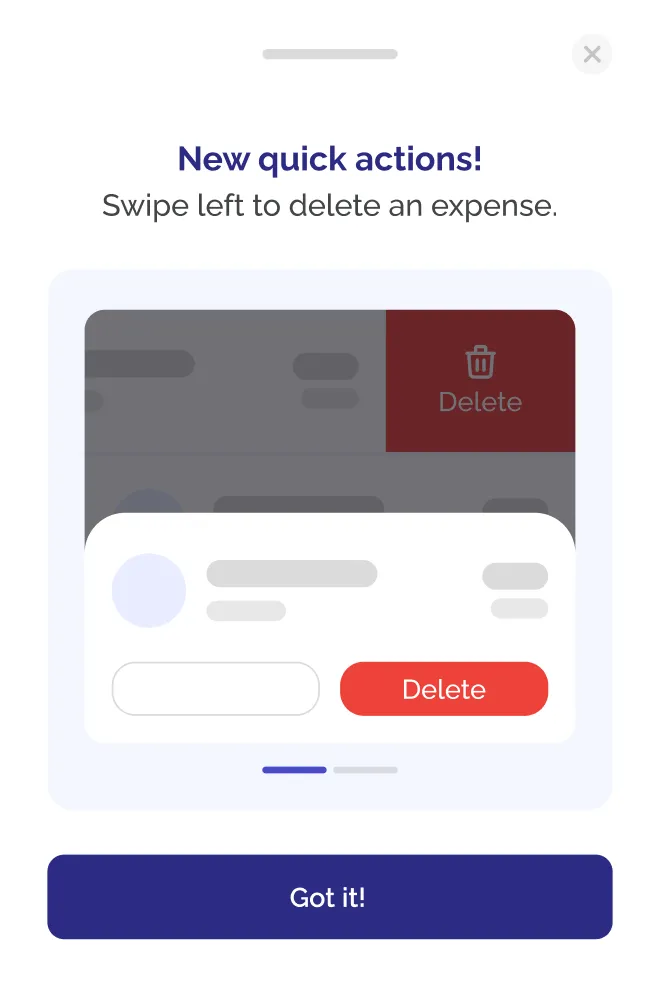
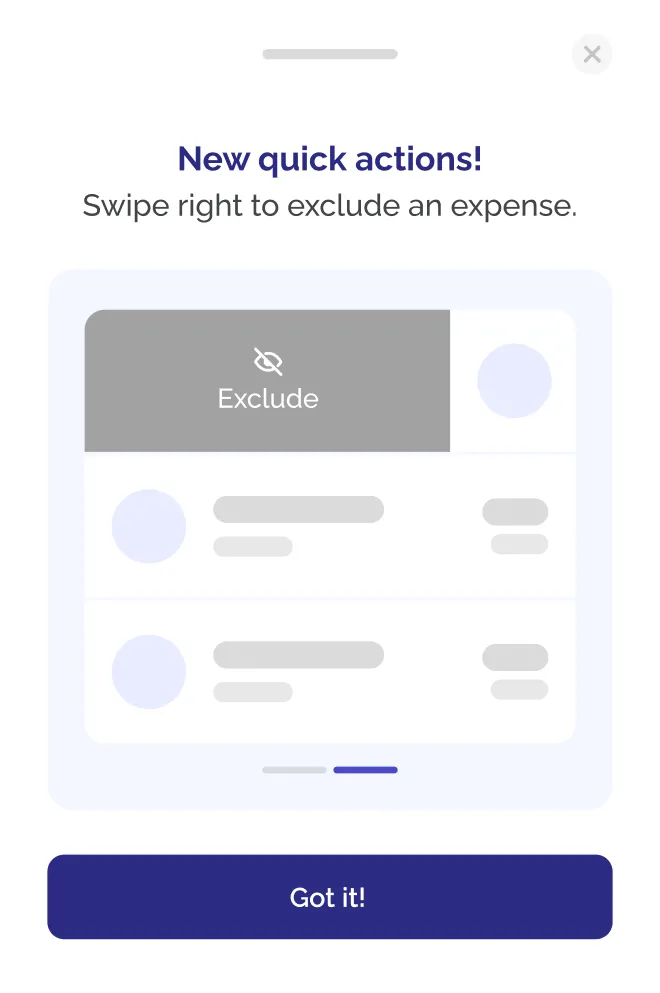
Swipe to exclude an expense from your totals, or to delete it. A swipe is invisible until someone shows you, so a short sheet teaches the gestures the first time you arrive.
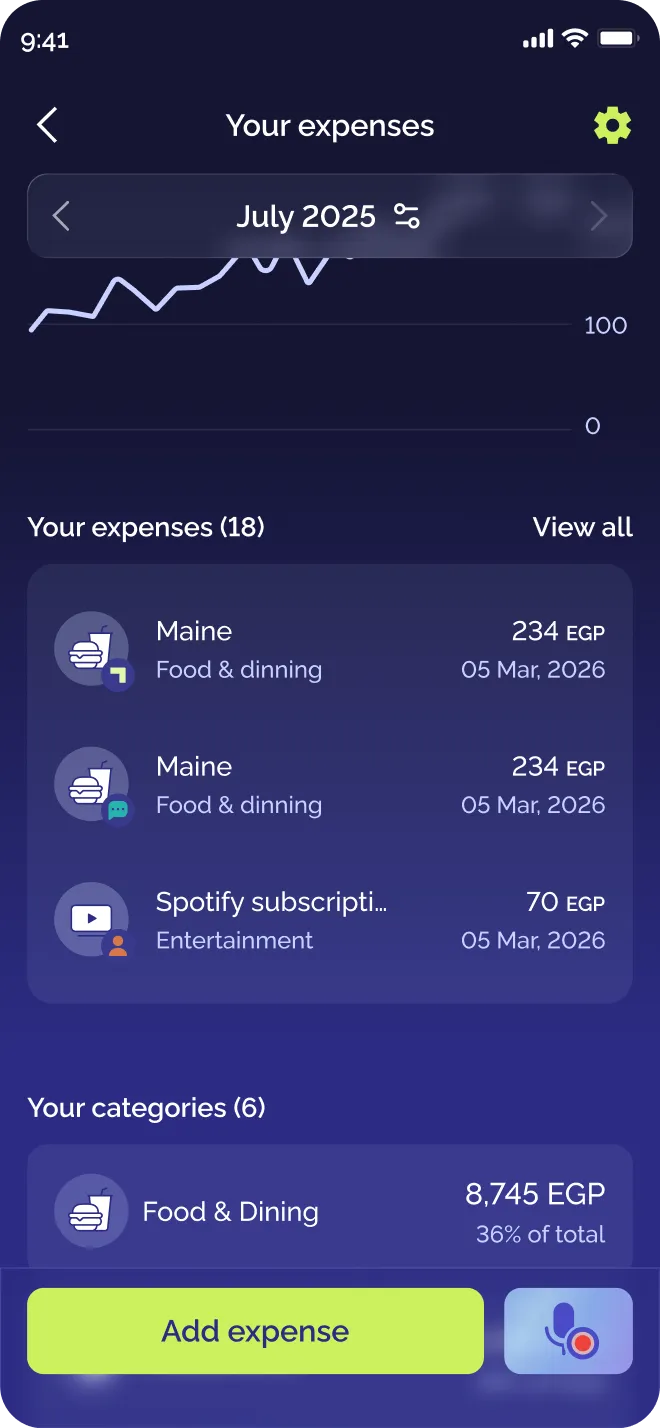
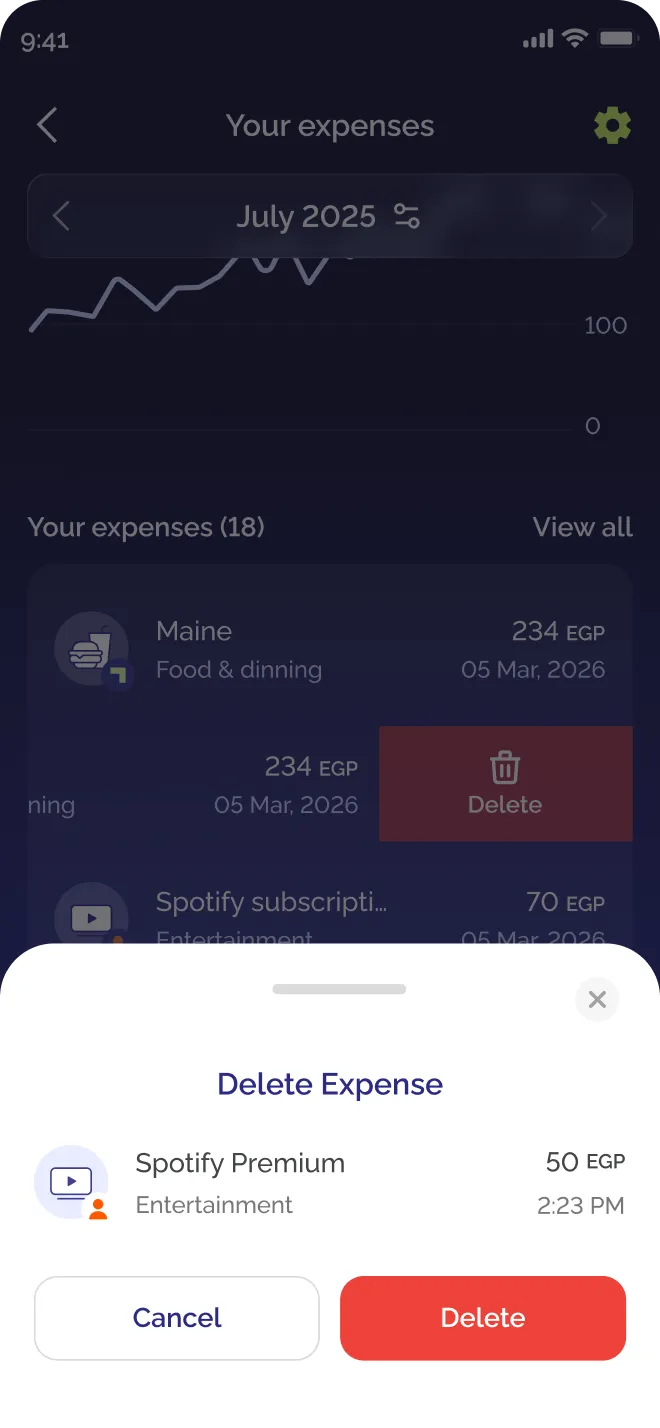
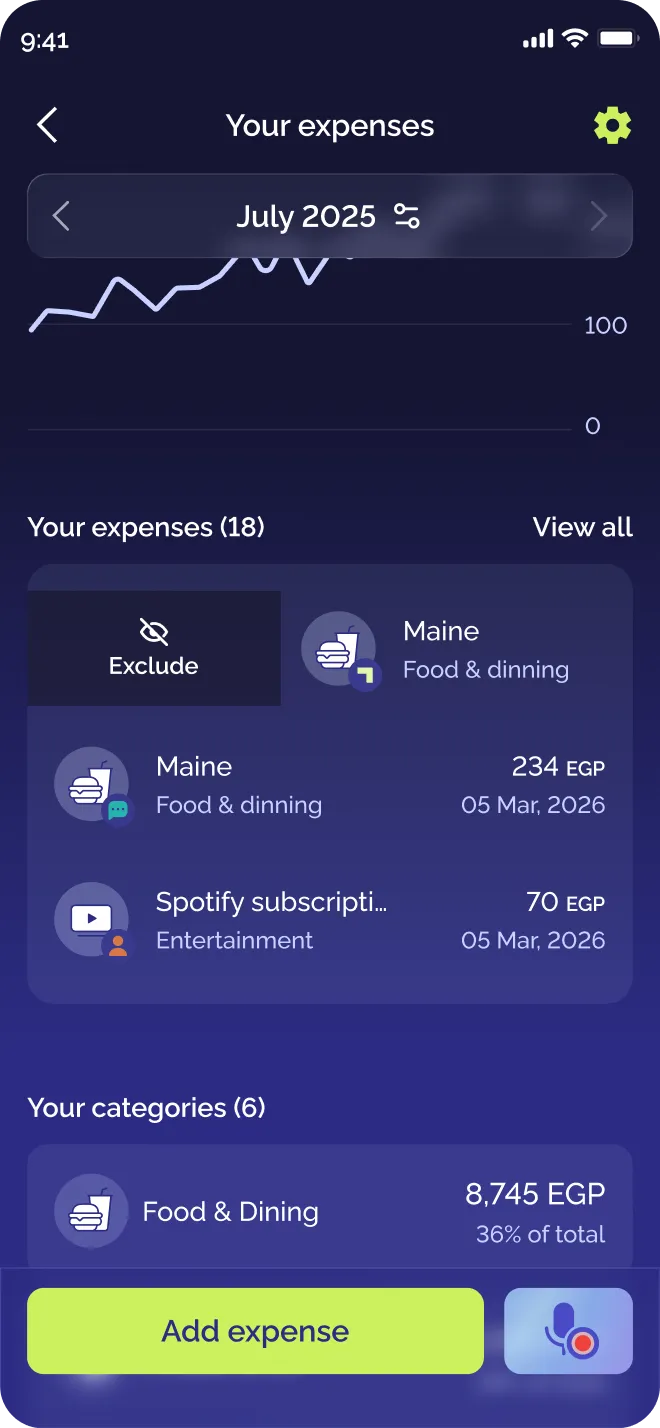
08 · Where it stands
Where it stands
Designed, handed off and waiting on release, so there are no adoption numbers to claim yet. The research left a baseline, and three questions for the launch data to answer.
01
Does the new title get people in?
Insights is now Expenses on the home screen. The first thing to watch is whether more people open it at all.
02
Do they reach their expenses?
The list used to hide behind a link nobody noticed. Now it sits in the expenses page, so visits should end on expenses instead of going back to Home.
03
Do the quick actions get used?
The swipe actions have no visible handle by design, and a first-use sheet teaches them once. Watch whether people swipe, or keep opening the row to edit instead.
Clearer, but the hierarchy fights itself. Filters sit above the tabs they control, and the tab name repeats the home entry.